
Building Expert Scorecard
Example Scorecard: Demographic Risk Scorecard
This scorecard evaluates the risk of borrowers based on demographic factors like Age and Employment Status.
Step 1: Define the Categories
- Category 1: Demographic Data
- Weight: 70%
- Category 2: Financial Stability
- Weight: 30%
- Default Deficit Category: 0% (Total weight = 100%)
Step 2: Add Criteria to Each Category
Category: Demographic Data
- Criterion 1: Age
- Type: Range
- Weight: 50% of Demographic Data
- Criterion 2: Employment Status
- Type: Variable
- Weight: 50% of Demographic Data
Category: Financial Stability
- Criterion 1: Credit History
- Type: Variable
- Weight: 60% of Financial Stability
- Criterion 2: Debt-to-Income Ratio
- Type: Range
- Weight: 40% of Financial Stability
Step 3: Add Attributes (Bins) for Each Criterion
Criterion: Age (Range)
- Range and Impact:
- 0–18: Impact = 20%
- 18–30: Impact = 60%
- 30–45: Impact = 100% (best range)
- 45–65: Impact = 80%
- 65–75: Impact = 40%
Criterion: Employment Status (Variable)
- Values and Impact:
- Unemployed: Impact = 20%
- Part-Time Employed: Impact = 50%
- Fully Employed: Impact = 100% (best value)
- Retired: Impact = 60%
Criterion: Credit History (Variable)
- Values and Impact:
- No History: Impact = 10%
- Poor History: Impact = 30%
- Good History: Impact = 70%
- Excellent History: Impact = 100% (best value)
Criterion: Debt-to-Income Ratio (Range)
- Range and Impact:
- 0%–20%: Impact = 100% (best range)
- 20%–40%: Impact = 80%
- 40%–60%: Impact = 50%
- 60%–80%: Impact = 30%
- 80%–100%: Impact = 10%
Step 4: Assign Scorecard Points
- Scorecard Range: 0–1000 points.
- Category Points Distribution:
- Demographic Data: 700 points (70% of total).
- Financial Stability: 300 points (30% of total).
- Criteria Points Distribution (calculated based on category weights):
- Age: 350 points (50% of 700).
- Employment Status: 350 points (50% of 700).
- Credit History: 180 points (60% of 300).
- Debt-to-Income Ratio: 120 points (40% of 300).
Step 5: Fine-Tune and Adjust
- Use Scorport’s dynamic interface to:
- Adjust weights for categories and criteria.
- Refine the impacts of attributes (bins) to better reflect the data or expert judgment.
Step 6: Finalize and Save
- Once the scorecard is complete, it will Version 1.
- You can use this scorecard in the Scorport’s Strategy Designer to Generate as an Engine.
This model is done by the AI, using Scorport Expert Modeling Methodology.
Sample Outputs
Example Borrower:
- Age: 29 → 60% impact (210 points out of 350).
- Employment Status: Fully Employed → 100% impact (350 points out of 350).
- Credit History: Good History → 70% impact (126 points out of 180).
- Debt-to-Income Ratio: 50% → 50% impact (60 points out of 120).
Final Score:
210 + 350 + 126 + 60 = 746/1000
This Demographic Risk Scorecard is now ready to assess borrowers based on the defined weights and impacts.
import pandas as pd
# Define the structure of the scorecard as a dictionary
scorecard_data = {
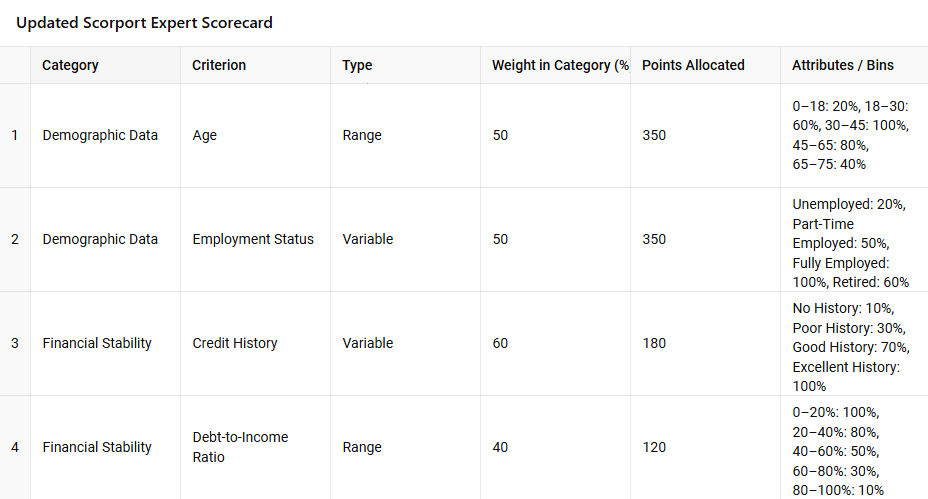
"Category": ["Demographic Data", "Demographic Data", "Financial Stability", "Financial Stability"],
"Criterion": ["Age", "Employment Status", "Credit History", "Debt-to-Income Ratio"],
"Type": ["Range", "Variable", "Variable", "Range"],
"Weight in Category (%)": [50, 50, 60, 40],
"Points Allocated": [350, 350, 180, 120],
"Attributes / Bins": [
"0–18: 20%, 18–30: 60%, 30–45: 100%, 45–65: 80%, 65–75: 40%",
"Unemployed: 20%, Part-Time Employed: 50%, Fully Employed: 100%, Retired: 60%",
"No History: 10%, Poor History: 30%, Good History: 70%, Excellent History: 100%",
"0–20%: 100%, 21–40%: 80%, 41–60%: 50%, 61–80%: 30%, 81–100%: 10%",
],
}
# Convert to a DataFrame
scorecard_df = pd.DataFrame(scorecard_data)
# Display the table
import ace_tools as tools; tools.display_dataframe_to_user(name="Scorport Expert Scorecard", dataframe=scorecard_df)
This model code is done by the AI, using Scorport Expert Modeling Methodology.

